
The Retail Store Performance System
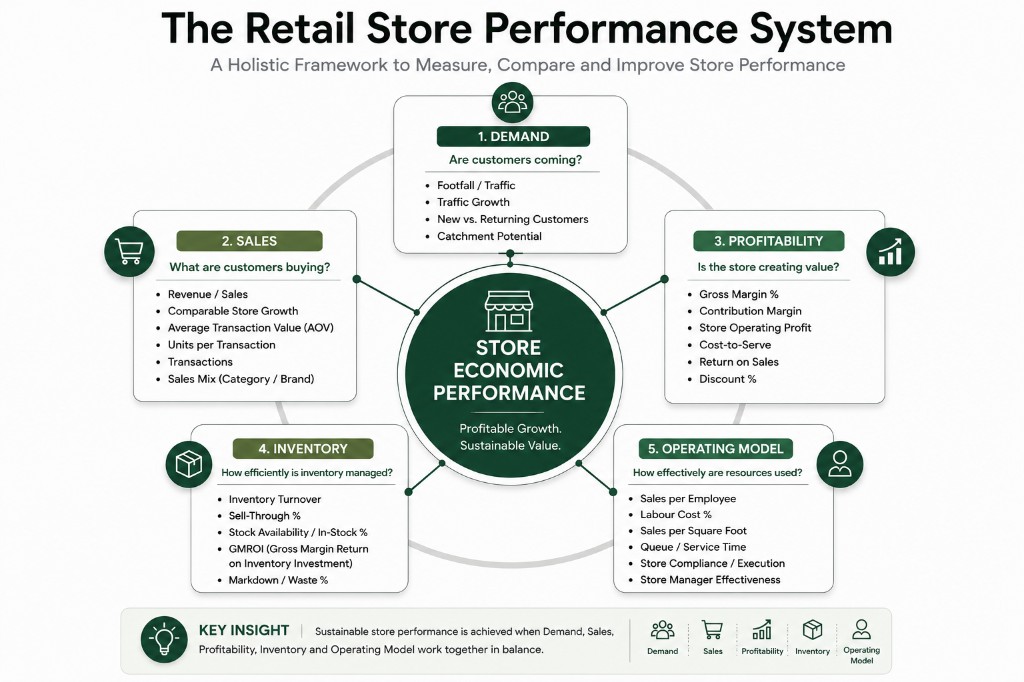
Figure 1. The Retail Store Performance System
A holistic framework to measure, compare and improve store performance.
A balanced retail performance system connects revenue to profitability, inventory productivity, customer outcomes, operating efficiency and store economics.
Source: Stratus Labs Executive Practice. Framework synthesized for retail performance-management advisory.
Sustainable store performance is not a single KPI. Demand, sales, profitability, inventory and the operating model must be read together. Leaders should use this architecture to design an executive scorecard—then drill into the dimensions that explain a gap, rather than expanding the dashboard indefinitely.
A retailer may operate fifty stores and know exactly which locations generated the highest sales last month. That ranking answers a narrow question. It does not explain whether those stores were genuinely better operated, whether location or market conditions drove the difference, whether margins were healthy, whether sales depended on discounting, whether inventory was productive, or whether the result can be reproduced elsewhere.
This is the difference between measurement and management. Measurement produces a league table. Management builds a system that separates signal from noise, tests what actually moves performance, and scales practices that hold under comparable conditions.
The thesis of this article is straightforward. High-performing stores are not a coincidence. They can become a source of repeatable learning—if the organization can distinguish structural advantage from controllable practice, and convert insight into disciplined action through a sequence of Measure, Benchmark, Diagnose, Validate, Pilot and Scale.
High-performing stores are not a coincidence. They can become a source of repeatable learning—if the organization can distinguish signal from noise and convert insight into disciplined action.
What are the most important retail store performance KPIs? In most networks, the answer is not a longer sales list. It is a balanced set of store performance metrics covering revenue and growth, profitability, inventory productivity, customer performance, operational execution and store economics—chosen for the decisions leadership must make. How to measure retail store performance then becomes a design problem: define those metrics consistently, compare stores within relevant peer groups, and use a retail performance dashboard to surface exceptions rather than to decorate monthly packs.
Why Sales Alone Are Not Enough
Revenue rankings remain useful. They are incomplete. A store can sit near the top of a sales list and still destroy value through weak contribution, slow inventory turns, heavy promotional dependency or an operating model that does not travel.
A high-sales store may carry unusually high rent, rely on deep discounting, hold excessive stock, show poor stock productivity, or operate with a cost base that peers cannot sustain. On a sales dashboard, it looks like a winner. On a store economics view, it may be a warning.
A lower-sales store may generate stronger contribution, higher sales per square foot, faster inventory turnover, stronger same-store growth, or more scalable operating routines. Ranking by revenue alone can cause leadership to celebrate the wrong model and overlook the transferable one.
Executives therefore need language that separates dimensions of performance: revenue and growth; profitability; efficiency and capital productivity; inventory productivity; customer performance; and operational execution. Retail store performance KPIs only become decision-useful when they are organised this way—and when leadership knows which dimension is currently constraining the network.
In practice, retail profitability analysis and inventory performance KPIs often change the ranking that sales alone produce. That is the point of a multi-dimensional scorecard: it forces leadership to confront trade-offs instead of celebrating a single number.
The Retail KPI Architecture
Retail store performance KPIs create more value when they are organised as a small architecture rather than a sprawling list. Retailers should not manage dozens of disconnected metrics. The more useful approach is a retail KPI architecture: a small number of performance dimensions, each with a clear management question, and an executive scorecard that mixes leading and lagging indicators.
The right KPI set depends on format, category, business model and management objectives. A fashion network, a grocery chain and a specialty retailer will emphasise different measures. What should not vary is coherence: definitions must be consistent, peer groups must be explicit, and every metric should answer a decision question rather than decorate a slide.
Revenue and growth metrics typically include total sales, same-store sales growth, average transaction value, units per transaction, footfall-to-purchase conversion, sales per square foot or square metre, and sales per employee. These answer whether demand is translating into commercial activity—and whether growth is genuine or merely inflated by space, hours or promotion.
Profitability metrics typically include gross margin, contribution margin, store operating profit, discount or promotional dependency, labour cost as a percentage of sales, occupancy cost as a percentage of sales, and, where relevant, EBITDA contribution or GMROI. These answer whether the store is creating economic value, not only volume.
Inventory productivity metrics typically include inventory turnover, days of inventory, stock availability, stockout rate, sell-through, slow-moving inventory, markdown exposure and GMROI. These answer whether capital tied in stock is working—and whether availability is protecting sales or masking weak assortment.
Customer performance metrics typically include conversion rate, basket size, average transaction value, repeat purchase where measurable, returns rate, and customer satisfaction or NPS where the business uses them with discipline. Operational metrics typically include sales per employee hour, labour productivity, schedule adherence, queue or wait time, store compliance, process exceptions, and replenishment performance.
Store economics and capital productivity close the loop: sales and contribution per square foot, rent-to-sales, store ROI, capex payback and new-store ramp-up. Together with the dimensions above, they form an executive KPI scorecard—balanced enough to prevent single-metric management, sparse enough to remain usable in a monthly review.
Figure 1 summarises that architecture. Demand, sales, profitability, inventory and the operating model should be read as one system. Expanding the dashboard without clarifying which questions leadership must answer usually creates noise, not insight.
Comparing Stores That Are Not Comparable
How do retailers compare different stores fairly? Not by ranking every location against a network average. One of the most damaging mistakes in multi-store performance management is treating the average as a peer. Averages hide structure. They encourage false confidence about "top" and "bottom" performers and can misallocate attention, capital and talent.
Like-for-like benchmarking should reflect factors such as store format, location type, size, age and maturity, market demographics, product mix, trading hours, catchment characteristics, seasonal conditions and the competitive environment. Without those lenses, a performance gap is often a comparison error.
Comparing a flagship mall store with a mature neighbourhood store using one sales target may tell management very little. The mall location may enjoy traffic density and brand presence the neighbourhood store cannot replicate. The neighbourhood store may show stronger local loyalty, different labour economics or a more transferable operating rhythm.
The practical rule of retail benchmarking is simple: benchmark against the right peer group before declaring a store a top or bottom performer. Peer groups turn multi-store performance comparison from a beauty contest into an analytical discipline—and they are a prerequisite for any serious attempt to replicate what works.
Benchmark against the right peer group before declaring a store a top or bottom performer.
From KPI Dashboard to Diagnosis
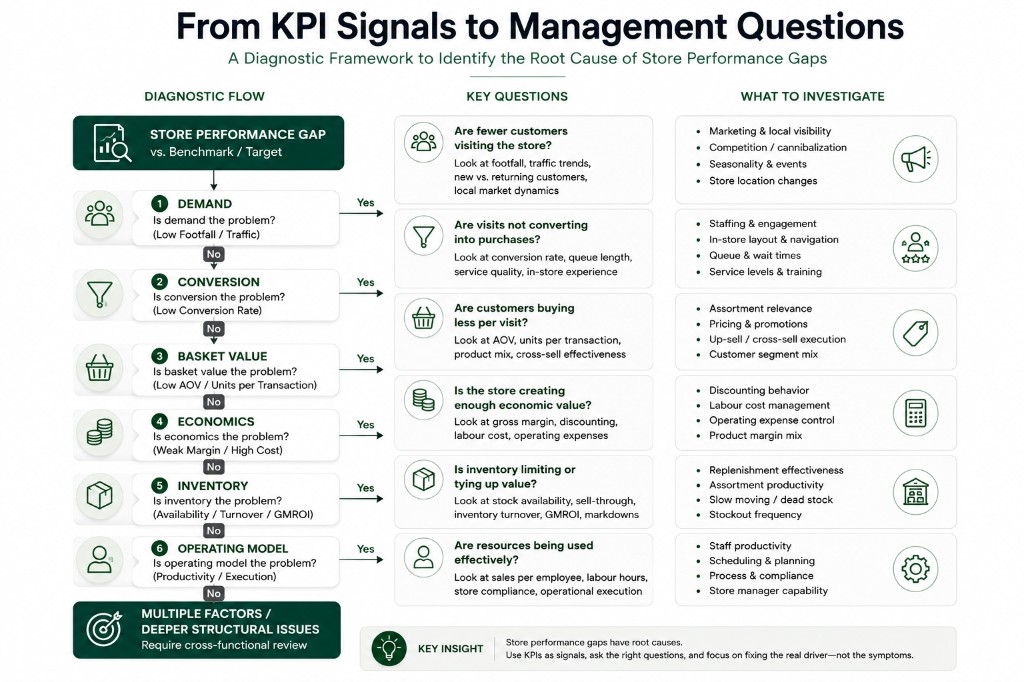
A retail performance dashboard identifies where performance differs. Analysis must then help explain why. The shift from store performance metrics to diagnosis is where many organizations stall: they build visibility, then skip the structured questioning that turns a signal into a management action.
Consider a common sequence. Sales sit below peer-group benchmark. Conversion is also below benchmark. Footfall is normal for the catchment. Stock availability is below peers, and stockouts concentrate in high-selling categories. The primary issue may not be demand. It may be replenishment and inventory availability—an operating and supply problem that a sales ranking alone cannot surface.
Other concise patterns illustrate the same logic. Sales above peers with weak contribution and rising discount rates may signal promotional dependency rather than commercial strength. Conversion below peers with normal staffing but long queues may point to layout, process or checkout design. Strong sales per square foot with weak inventory turns may indicate under-assortment in the wrong places or an aggressive markdown cycle masking earlier buying mistakes.
In each case the method is the same: start from the performance signal, ask the next management question, investigate the operational evidence, and only then decide the intervention. Retail analytics create value when they compress that path—not when they multiply charts.
A third example: labour cost as a percentage of sales looks healthy, yet sales per employee hour is weak and schedule adherence is poor. The issue may be roster design and task allocation rather than headcount. Diagnosis converts a store performance metric into an operating question.
Figure 2 illustrates a diagnostic flow from store performance gaps to management questions and investigation areas across demand, conversion, basket value, economics, inventory and the operating model. Use it as a questioning discipline, not as a rigid script.
Finding Patterns Worth Replicating
How do you identify why one store performs better than another? Start by refusing to treat the hero store as an automatic template. A high-performing store should not automatically become the model for the entire network. Structural advantages—location, catchment, format, brand density—do not travel. Controllable practices might. Leadership's job is to tell the difference.
Useful questions include: What is actually different about this store? Which differences are structural? Which are controllable? Which factors correlate with performance? Which practices appear repeatedly among high performers in the same peer group? Which are feasible elsewhere given labour markets, systems and local constraints?
Analytical dimensions often include staffing models, management routines, store layout, product availability, assortment, local pricing, promotional execution, replenishment, opening and closing routines, training, service model and trading hours. The point is not to copy a hero store wholesale. It is to isolate practices that survive scrutiny.
Keep the distinction practical. Correlation says: this high-performing store does X. Causation asks: when X changes under comparable conditions, does performance improve? Organizations that skip that test scale anecdotes. Organizations that insist on it scale learning.
Correlation says this high-performing store does X. Causation asks whether performance improves when X changes under comparable conditions.
That insistence is also where strategy and transformation advisory meets day-to-day retail operations: the question is not only what the data shows, but which operating choices the leadership team is prepared to standardise.
How AI Can Improve Retail Store Performance Analysis
AI and advanced analytics can improve retail store performance analysis by helping leadership process larger volumes of store, sales, inventory, customer and operational data than a manual review can handle. Used well, AI-powered retail analytics accelerate pattern detection and exception prioritisation. Used poorly, they generate another layer of unexplained signals.
Practical applications include anomaly detection across stores; identifying unusual combinations of sales, margin, inventory and labour metrics; detecting early performance deterioration; surfacing candidate drivers of high or low performance within comparable store groups; demand and inventory forecasting; store-level exception prioritisation; pattern recognition across peer groups; and, where data quality allows, natural-language querying of performance data. The useful shift is from "What happened?" to "What should we investigate next?"
For example, instead of manually reviewing 200 stores, a machine-learning or predictive analytics layer could identify locations where sales are falling despite stable footfall, inventory availability and staffing. Management then investigates a smaller, more relevant group. That is diagnostic acceleration—not automatic proof of cause.
AI can accelerate pattern detection, anomaly identification and hypothesis generation. It does not automatically establish causation. Leadership must still validate whether the pattern is real, whether the driver is controllable, whether an intervention improves results, and whether the result can be replicated. In the Retail Performance Replication Loop, AI strengthens Measure and Diagnose. It does not remove Benchmark, Validate, Pilot or Scale.
Where AI and analytics advisory is useful, it should sit inside that loop: improve the quality and speed of hypotheses, then subject them to the same peer-group and pilot discipline as any other insight. Retail organizations do not need an "AI strategy" detached from store performance management. They need faster, more disciplined diagnosis that still earns the right to scale.
How Leading Retailers Use Data and Experimentation
Publicly documented examples illustrate how leading retailers increasingly combine granular performance data with experimentation and operational discipline. The examples below are drawn from company and industry sources. They are not Stratus Labs client engagements, and they should not be read as endorsement or partnership.
Walmart has publicly described dedicated test stores used to prototype technology, digital tools and operating changes, with product and technology teams embedded to iterate in real time, scale what works and discard what does not. Reported tests have included omni-assortment availability, backroom-to-floor inventory speed, first-time pick rates for online fulfilment and checkout experience changes. The management lesson is process, not romance: controlled pilots with clear operating metrics beat network-wide roll-outs of untested ideas.
Inditex has long emphasised store productivity and inventory discipline as part of its retail model. In recent results commentary, the group has linked store optimisation—openings, refurbishments, enlargements and absorptions—to a higher-quality store base, while reporting inventory managed carefully against trading conditions and continued investment in logistics capacity. The lesson for multi-store operators is that inventory performance KPIs and store economics belong in the same conversation as sales.
Tesco's long-running use of Clubcard data, including through its partnership with dunnhumby, shows how customer and transaction insight can inform assortment, category development and availability decisions at store and product level. Public reporting has described using granular purchase data to understand performance, simplify ranges and detect availability issues that would otherwise be misread as weak demand. The lesson is diagnostic: transaction signals can distinguish "not selling" from "not available"—a distinction every retail performance dashboard should force.
None of these companies invented the need for peer-aware benchmarking or test-and-learn discipline. What they illustrate is a management posture: treat stores as a learning system, instrument the operating levers that matter, and refuse to scale on correlation alone. Retail organizations of any size can adopt that posture without copying another company's technology stack.
For leadership teams, the transferable discipline is consistent: instrument the store network, compare like with like, form hypotheses, test them, and only then industrialise the change. That is how retail store analytics support multi-store performance rather than merely reporting it.
The Retail Performance Replication Loop
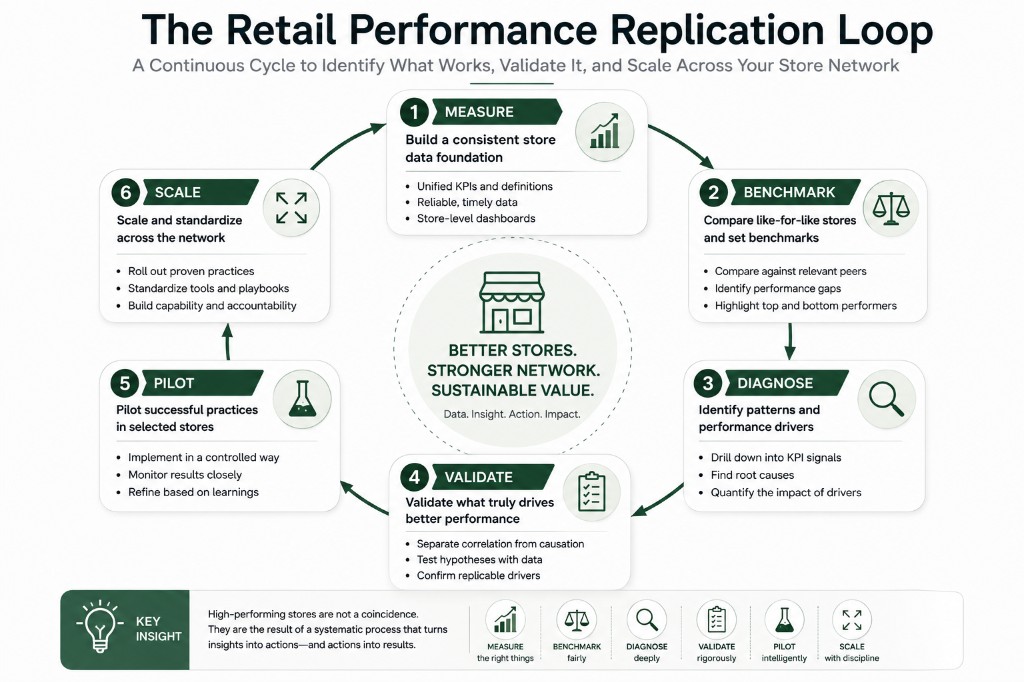
What is a retail performance management system? It is not merely a larger retail analytics dashboard. It is the operating discipline that turns measurement into comparable benchmarking, diagnosis, validation, piloting and scale. The signature framework of this article is the Retail Performance Replication Loop: Measure, Benchmark, Diagnose, Validate, Pilot, Scale. Insight without validation is opinion. Validation without piloting is theory. Scaling without either is risk.
Measure builds a consistent store data foundation: unified KPI definitions, reliable and timely data, and store-level views that operations and finance trust. Benchmark compares like-for-like stores and sets meaningful performance ranges. Diagnose identifies patterns, anomalies and candidate drivers—moving from retail dashboard KPIs to root-cause hypotheses.
Validate tests whether suspected drivers actually influence performance under comparable conditions. Pilot implements promising practices in selected stores, monitors results and refines the approach. Scale standardises proven practices through playbooks, process design, system controls and capability building. The missing stages in many networks are validation and piloting. Scale should not follow immediately after a vivid anecdote from a hero store.
Figure 3 summarises the loop. High-performing stores become more valuable when the organization can turn them into evidence—then into standards that improve the network without assuming every location is identical.
Building a Practical Store Performance System
A practical store performance system is built in stages. First, define the decision questions: what must the CEO, COO, CFO, operations leaders and store managers decide weekly and monthly? Dashboards should follow those questions, not precede them. Governance and performance routines matter as much as chart design.
Second, standardise KPI definitions so sales, margin, inventory and labour metrics mean the same thing across the network. Third, build comparable store peer groups so rankings and targets reflect reality. Fourth, create executive and operational views: senior leaders need a scorecard; store managers need actionable exceptions. They should not be forced into the same screen.
Fifth, establish a performance review cadence—often a weekly operational rhythm and a monthly executive review, adapted to the business. Sixth, build test-and-learn capability so interventions can be piloted and measured. Seventh, scale proven practices into standards, playbooks, processes or system controls, supported where needed by digital and enterprise systems and ERP and core systems that make definitions and replenishment disciplines durable.
For networks modernising data foundations, programme and PMO discipline helps keep measurement work connected to operating outcomes rather than becoming an endless reporting project. For sector context beyond retail operations, leaders can also review Stratus Labs' technology industry perspectives where systems and operating-model choices intersect.
Retailers that treat this as a technology project alone usually rediscover the same problem in a new interface. The durable asset is the operating rhythm: peer groups, diagnostic questions, pilot governance and the willingness to stop ideas that do not prove out.
Implementation does not require perfection on day one. It requires a decision-led scorecard, honest peer groups, a diagnostic habit, and the organisational patience to validate before scaling. That is how retail store analytics become a management asset rather than a reporting cost.
What should a retail performance dashboard include? An executive retail performance dashboard should normally provide six views: a network overview of sales, growth, margin, inventory and major exceptions; store comparison through peer-group rankings, comparable-store performance and top/bottom exceptions; store economics covering contribution, labour, occupancy and profitability; inventory performance covering availability, stockouts, turnover, slow-moving stock and markdown exposure; diagnostic drill-down from a performance signal to likely investigation areas; and action tracking for owner, intervention, pilot status and measured result.
A store performance dashboard should not simply contain all available KPIs. It should support the decisions different management levels need to make. Senior leaders need a scorecard and exceptions. Store and regional managers need actionable drill-downs. Finance needs contribution and inventory productivity. A retail analytics dashboard that cannot move from signal to investigation, or from investigation to owned action, is incomplete—regardless of how visually polished it appears.
Power BI and similar tools can present these views effectively when definitions, peer groups and data feeds from POS, ERP, finance, inventory and workforce systems are designed first. The tool choice is secondary to the management design of the retail performance management system.
Organizations in Pakistan and internationally face the same structural temptation: celebrate the top sales store, mandate its practices network-wide, and discover too late that the advantage was location, catchment or an unreplicable cost base. Local market conditions matter. The management method does not change.
Common Failure Modes
Five failure modes recur. Measuring too many KPIs dilutes attention; the alternative is a decision-led scorecard with clear owners. Ranking incomparable stores creates false heroes and villains; the alternative is peer-group benchmarking. Treating correlation as causation scales coincidence; the alternative is validation under comparable conditions.
Building dashboards without management routines produces unread reports; the alternative is a cadence that forces decisions. Scaling ideas before validating them multiplies risk; the alternative is pilot, measure, then standardise. Each failure mode is avoidable with discipline more than with software.
These failure modes are organisational, not technical. Software can display KPIs. Only leadership can insist on peer groups, diagnostic questioning, and the patience to validate before scale.
Need a Retail Performance Framework, Dashboard or Tracking System?
Many retail organizations do not need another generic KPI list. They need the practical infrastructure behind a retail performance management system: clear definitions, comparable store groups, an executive scorecard, a store performance dashboard and a review cadence that turns data into decisions.
A practical system may include a KPI architecture and KPI dictionary; an executive retail performance scorecard; store-level performance reporting; a comparable-store or peer-group methodology; profitability and contribution analysis; inventory and stock productivity views; store ranking and exception reporting; management drill-down logic; POS, ERP, finance, inventory and workforce data requirements; Power BI or other analytics dashboard requirements where appropriate; AI-enabled pattern and anomaly analysis where data quality supports it; and weekly and monthly performance review routines.
Whether the immediate need is a KPI framework, executive dashboard, store performance reporting model or a broader system that connects POS, inventory, finance and operational data, the starting point should be the decisions leadership needs to make—not the charts available in the software. If your organization is defining its store performance framework, we can discuss the KPI definitions, scorecards, dashboard requirements and analytical routines required for your operating model.
Executive Takeaway
The best-performing store should not simply be celebrated. It should be investigated. Retail organizations create greater value when they systematically understand what works, where it works, why it works, whether it can be reproduced, and how to scale it without losing effectiveness.
Sales will always matter. Sustainable multi-store performance comes from a system that connects retail KPIs to diagnosis, validation and disciplined replication. That is how high-performing stores stop being anecdotes—and start becoming an operating advantage.
Frequently Asked Questions
The questions below address the issues leadership teams typically raise first when designing or refreshing a store performance system.
Frequently asked questions
- 01
What are the most important KPIs for measuring retail store performance?
There is no universal mandatory list. A balanced set usually covers revenue and growth, profitability, inventory productivity, customer performance, operational execution and store economics. Choose metrics that answer management decisions for your format and model.
- 02
How should retailers compare the performance of different stores?
Compare like-for-like peer groups using format, location type, size, maturity, catchment, mix, hours and competitive context. Avoid ranking every store against a network average when those conditions differ.
- 03
What is the difference between store sales and store profitability?
Sales measure volume. Profitability measures whether that volume creates economic value after cost, discounting, labour, occupancy and inventory effects. A high-sales store can still be a weak economic performer.
- 04
How can retailers identify what high-performing stores do differently?
Separate structural advantages from controllable practices, look for patterns within peer groups, and test whether suspected drivers improve results under comparable conditions before treating them as a network standard.
- 05
Which retail KPIs help measure inventory performance?
Common measures include inventory turnover, days of inventory, stock availability, stockout rate, sell-through, slow-moving stock, markdown exposure and GMROI. Pair them with sales and margin so availability and productivity are not read in isolation.
- 06
How can a retailer replicate successful practices across multiple stores?
Use a Measure–Benchmark–Diagnose–Validate–Pilot–Scale loop. Validate drivers, pilot in selected stores, then standardise what works through playbooks, process design, capability building and system controls.
- 07
What should a retail performance dashboard include?
A useful retail performance dashboard typically covers network overview, peer-group store comparison, store economics, inventory performance, diagnostic drill-down and action tracking. It should support decisions at each management level—not display every available KPI.
- 08
How can AI be used to improve retail store performance?
AI can accelerate anomaly detection, exception prioritisation, forecasting and hypothesis generation across store, sales, inventory and operational data. It does not automatically prove causation. Leadership still needs to validate, pilot and scale carefully.
- 09
What is a retail performance management system?
A retail performance management system combines KPI definitions, peer-group benchmarking, diagnostic routines, scorecards or dashboards, and a review cadence that moves from insight to validated action—typically through Measure, Benchmark, Diagnose, Validate, Pilot and Scale.
Executive insights
Manage dimensions, not league tables
Read revenue, profit, inventory, customers, operations and store economics together before celebrating a top sales store.
Peer groups before rankings
Declare top and bottom performers only after like-for-like benchmarking.
Do not scale correlation
Validate and pilot controllable practices before network-wide roll-out.
Turn heroes into learning
Investigate high performers systematically so the network gains repeatable advantage.
Published August 21, 2026 · Updated August 21, 2026 · 16 min read
Related industries: Technology
Related capabilities
Strategy Consulting & Business Transformation
Strategy consulting for leadership teams that need clearer choices, a practical operating model and a transformation roadmap they can fund, govern and measure.
Corporate Governance Consulting
Corporate governance consulting for boards and executives who need clearer decision rights, committee charters, board reporting and risk governance that keep pace with the business.
Digital Transformation Consulting
Digital transformation consulting for organizations modernizing platforms, enterprise architecture and operating processes without losing business control or creating new complexity.
ERP Consulting & Implementation Advisory
ERP consulting for organizations selecting, implementing or recovering enterprise systems—with process ownership, data readiness and governance before capital and go-live decisions lock in.
PMO Consulting Services
PMO consulting for organizations that need programme management, portfolio governance and executive reporting that surface risk early and keep benefits honest.
AI Consulting & AI Strategy Advisory
AI consulting for leaders who need governed analytics, a practical AI strategy and decision systems with clear ownership, data readiness and responsible-use controls.
Continue the Conversation
If your organization is navigating governance, ERP modernization or business transformation, our advisory team can help.